Selecting the Ideal Smartphone Camera Within Your Budget
When shopping for a smartphone, many consumers weigh the camera quality as a decisive factor. With the myriad of choices on the market, discerning which device offers the best camera for the price can be challenging. An invaluable tool for consumers is the research and ratings of smartphone cameras by DXOMARK, widely recognized for setting industry benchmarks.
Utilizing Scatter Plots for Smart Purchases
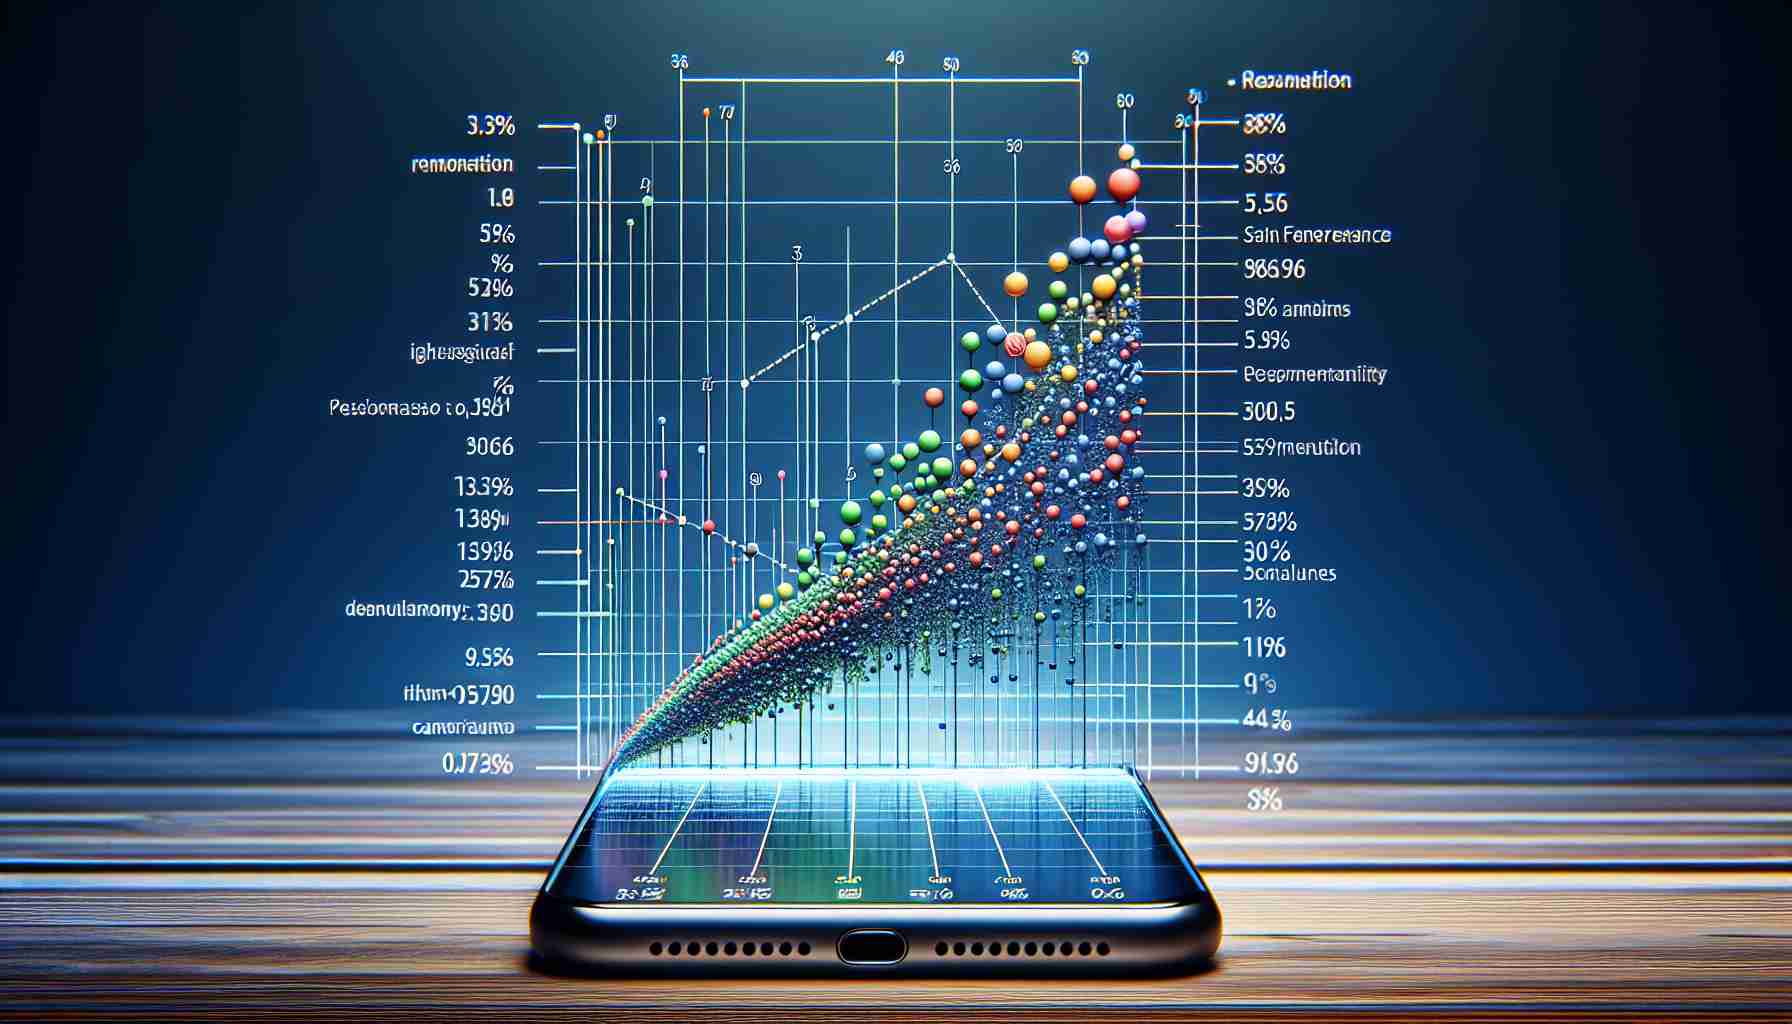
To simplify this complex decision, utilizing scatter plots can be incredibly useful. These graphs provide a visual correlation between two variables, in this case, the price of a smartphone and its camera capabilities. Scatter plots are particularly helpful for a quick visual assessment, and our enhanced version includes a trend line to better illustrate the underlying relationship between cost and camera performance.
Any smartphone model found below this trend line might suggest a less favorable balance of cost against camera functions. The horizontal axis of the plot reveals the ascending prices, directing budget-conscious consumers to look leftward. In contrast, the vertical axis showcases the camera’s capabilities, urging individuals desiring superior camera performance to focus on points higher up.
Our chart is interactive and allows for a tailored viewing experience. Users have the flexibility to filter results by price segment or manufacturer preference, enhancing the practical application of this comparative tool.
Clarifying the Scatter Plot Data
It’s important to recognize certain parameters about the data in the plot. Smartphone prices referenced are based on initial global market values, not accounting for regional tax variations. The data is solely derived from DXOMARK’s findings, excluding any models they’ve yet to evaluate. Moreover, this specific chart considers only the price against camera performance and omits other technological aspects such as screen quality, CPU power, or battery life. Additionally, while some phones, especially those with unique features like foldable screens, appear below the trend line, they may possess other distinctive market appeals notwithstanding their camera performance or cost.
Understanding Smartphone Camera Quality vs Price: A Graphical Analysis
When looking for a new smartphone, the camera quality is often a top consideration for many buyers. The camera’s ability to capture sharp, vivid pictures and smooth video can be pivotal in the choice of one device over another. However, the cost of a smartphone doesn’t always align with its camera capabilities. Making a value-for-money decision involves understanding the balance between camera quality and the price paid.
Key Questions and Answers:
Q: What is the role of scatter plots in analyzing smartphone camera quality versus price?
A: Scatter plots help visualize the relationship between the cost of a smartphone and its camera quality. By placing individual smartphone models on a graph based on these two criteria, potential buyers can easily see which phones offer the most value for their camera performance at various price points.
Q: Are there other factors to consider when purchasing a smartphone aside from the camera quality?
A: Yes, while camera performance is significant, other factors such as screen resolution, processor speed, battery life, build quality, operating system, and special features like waterproofing or expandable storage also play crucial roles in the decision-making process.
Key Challenges or Controversies:
One challenge while using the scatter plot for decision-making is the dynamic nature of smartphone pricing. Prices often drop over time due to sales promotions, release of newer models, or other market factors. This can affect the accuracy of the plot over time. A controversy worth noting is the reliability of DXOMARK’s ratings, as some critics argue they can be subjective or influenced by partnerships with smartphone manufacturers.
Advantages and Disadvantages:
Advantages:
– Scatter plots provide an immediate visual comparison, highlighting value purchases.
– Interactive charts can be customized to reflect user preferences such as price ranges or brand loyalty.
– DXOMARK ratings are a trusted industry standard for camera performance benchmarks.
Disadvantages:
– The scatter plot only reflects initial global market values and may not represent current local prices.
– The chart relies solely on DXOMARK ratings, which may not encapsulate all user experiences or reviews.
– The graph excludes other smartphone features which might be equally important to camera quality for some users.
For readers keen to delve deeper into smartphone analysis or explore further information on camera technology, you can visit the homepage of DXOMARK at DXOMARK. Another useful resource for broader smartphone comparisons would be a tech news site such as The Verge or a consumer electronics reviewer like CNET. These sites often review and compare a wide range of smartphone features including camera performance.
